Graphs and Charts
Mathematics Worked Examples by Topics
| Number | Mathematical Skills | Applications |
|---|---|---|
| 1 | Number, percentages, and percentiles | Determining the amounts, costs, and dimensions of materials |
| 2 | Ratio | Scaling models, dimensions, shapes, and drawings |
| 3 | Surface area/Volume | Finding costs of quantities, waste amounts |
| 4 | Trigonometry | Calculating angles/lengths of products |
| 5 | Graphs and charts | Using data to make decisions/visualization of data |
| 6 | Coordinates and geometry | Using coordinates for design drawings |
| 7 | Statistics | Using data to make informed design decisions |
Graphs and Charts
Question 1)
The table shows the test scores for a class. Using a cumulative frequency curve estimate the number of scores greater than 65.
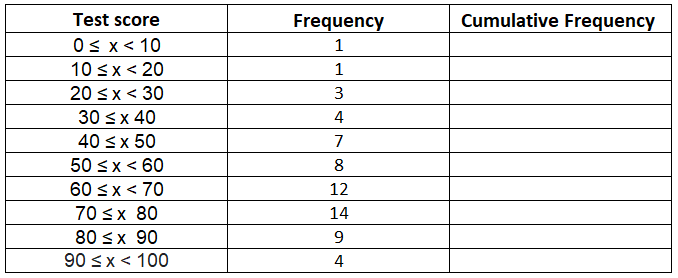
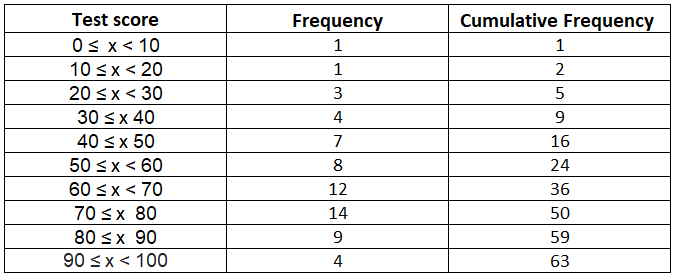
Step 1) Calculate the cumulative frequency in the table:
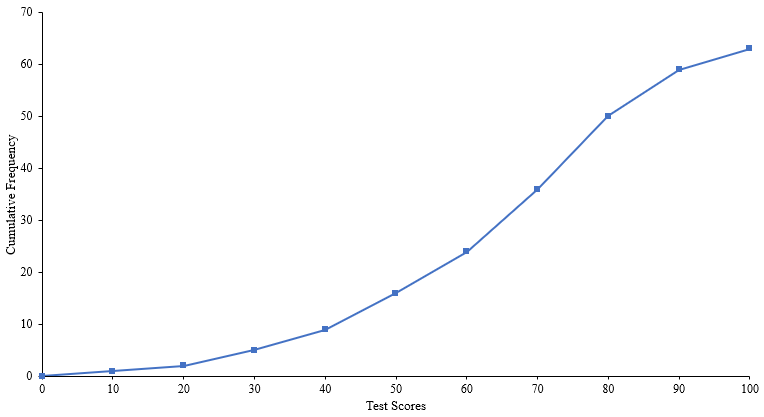
Step 2) Draw a cumulative frequency graph
Step 3) Calculate number of scores above 65:
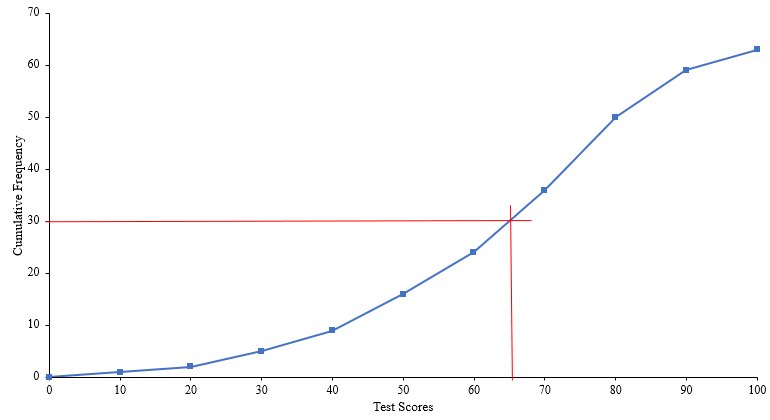
Total scores above 65 = 63 - 30 (From graph) = 33 scores